Every business today is drowning in data stored in scattered spreadsheets, dashboards, emailed PDFs, and version 2 of version 2. But this scattered data won’t help in translating into smart decisions. Eventually, it leads to unnecessary time consumption in clearing data, chasing updates, and wrestling with tools instead of acting on insights.
That’s where the report management system or report management software steps in. Instead of a piecemeal approach, an RMS provides a central framework for generating, distributing, and monitoring reports with clarity and consistency.
In this blog, we’ll break down what exactly What a reporting software is, explore its different types, and walk you through popular examples of reporting tools.
Key Takeaways
- Businesses that invest in report management software gain real-time visibility and faster decision-making.
- A good reporting software eliminates manual compilation, reduces human errors, and provides real-time visibility over organizational data.
- You should select a reporting tool that’s integrated into your business OS and unifies data from different departments.
- Organizations that centralize reporting today will benefit from data-driven growth and agility.
- Popular examples of reporting tools include CollabCRM, Microsoft Power BI, Tableau, Looker, and Zoho Analytics.
What is a Reporting Software or Report Management System?
Reporting software, or a report management system, is an application that extracts data from various sources, organizes it, and presents it in a visually structured and easy-to-understand format like tables, graphs, or dashboards. Modern reporting software enables enterprises to centralize insights and maintain consistent visibility across departments.
These report management systems are used by businesses to analyze performance, track progress across initiatives managed through project management software, improve decision-making, and share key information with stakeholders.
Core Capabilities of an Effective Reporting Software
Core capabilities of reporting software include data aggregation and integration, report generation, data visualization, distribution, and performance tracking.
Let’s understand each function of reporting tools to know how they help:
1. Data aggregation and integration
Report management software pulls information from multiple sources databases such as sales CRM software, ERPs and spreadsheets into one place. This eliminates manual data gathering and reduces errors from switching between systems.
2. Report generation
Creates various reports, from standard daily or monthly summaries to customized, ad hoc reports supporting workforce analytics within people management software.
3. Data visualization
Presents data in a visual format with charts, graphs, and dashboards to make it easier to grasp trends and performance.
4. Scheduling and distribution
Automates report delivery on recurring schedules, including compliance, hiring, and workforce metrics generated through HR management software. Send daily sales reports at 8 AM, weekly inventory updates on Fridays, and monthly financial statements to stakeholders. This reduces manual workload and ensures consistency.
5. Export and sharing
Allows exporting reports with custom fields in formats of your choice (from PDF, Excel, CSV, and PowerPoint) and sharing with other stakeholders. Through this, reporting tools facilitate collaboration and integration with different workflows.
Types of Reports In a Report Management System
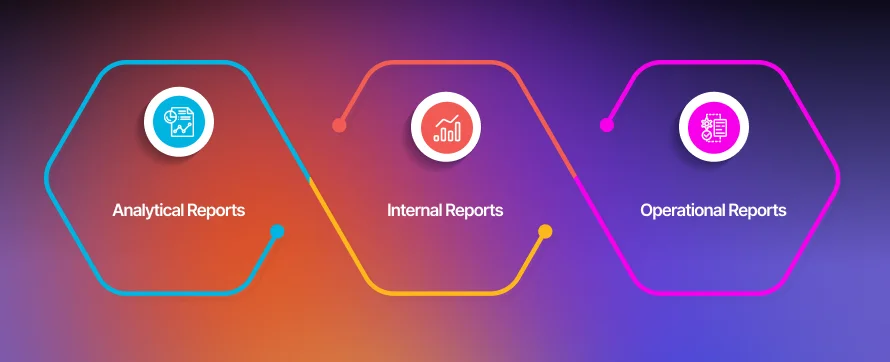
Reporting software can generate a wide variety of reports, including informational, analytical, and operational reports, which are often categorized by their purpose.

1. Analytical Reports
Analytical reports in report management software helps leaders and teams dig deeper into why something happened. They combine historical data, patterns, and KPIs to uncover trends, evaluate performance, optimize the project management process, and guide strategic planning.
For example, sales managers can track lead conversion rates, performance of sales representatives, and more to forecast future revenue.
2. Internal Reports
Internal reports are all about visibility inside the organization. These are the reports managers, HR teams, or department heads rely on to stay aligned and make informed, cross-functional decisions.
For example, project progress updates, employee productivity dashboards, or departmental expense summaries.
Also Read: Why Streamlining HR Operations Should Be the Priority for Growing Companies
3. Operational Reports
Operational reports keep your day-to-day activities running smoothly. They focus on what’s happening right now, such as task completion rates, inventory levels, customer support response times, or ongoing project status.
These reports are often generated automatically and updated in real time, giving teams the agility to act fast when performance dips or priorities shift.
For example, the immediate status of resources, work and planning data, and work trends data.
Benefits of Using Report Management Software
If a reporting management software is selected and configured correctly, it can provide benefits such as increasing productivity and accuracy by automating manual tasks, enabling self-service reporting for non-technical users, and providing valuable business insights through data visualization.
Let’s have a look at key benefits you can expect from reports software:
- Automates time-consuming manual tasks like data collection and formatting, freeing up employees to focus on strategic work.
- Reduces human error inherent in manual reporting, ensuring more precise and reliable data.
- Transforms raw data into easy-to-understand visuals like graphs and dashboards, helping identify trends and key performance indicators.
- Provides real-time, data-driven insights that enable more informed and confident business decisions.
- Streamlines operations and identifies inefficiencies, which can lead to reduced administrative costs and better resource optimization.
- Handles increased reporting demands as a business scales, ensuring the effort to generate reports remains manageable.
- Empowers non-technical users to generate their own reports, reducing reliance on IT departments.
- Allows different teams access to the same data, improving communication and alignment across the organization.
| Aspect | Before Reporting Software | After Reporting Software |
| Data Collection | Manual, error-prone, and slow. | Automated and real-time. |
| Report Generation | Inconsistent and time-consuming. | Instant, standardized, and customizable. |
| Decision-Making | Based on outdated data. | Driven by live insights. |
| Collaboration | Siloed teams and scattered files. | Centralized, shared dashboards. |
| Data Accuracy | Frequent human errors. | Clean, validated data. |
| Performance Tracking | Hard to track KPIs or trends. | Real-time performance visibility. |
| Scalability | Struggles with data growth. | Grows seamlessly with business. |
| Compliance | Manual, stressful audits. | Automated logs and easy tracking. |
| Productivity | Time wasted compiling data. | Focus on analysis and strategy. |
| Business Agility | Reactive decisions. | Proactive, data-led actions. |
Examples of Reporting Tools
Popular examples of reporting tools include CollabCRM, Microsoft Power BI, Tableau, Looker, and Zoho Analytics.
Let’s discuss briefly about all the reporting tools:
1. CollabCRM Reports
CollabCRM is a business operating system with integrated Reports modules that go beyond traditional reporting tools. It has integrated analytics into every module, including CRM, HR, Recruitment, Projects, Invoicing, and more. Instead of exporting data into third-party dashboards, it enables teams to check reports without switching to another reporting tool.
From sales pipelines to employees’ productivity to project progress, CollabCRM’s Report module makes every metric trackable, customizable, and shareable. It also adds an extra layer of security by integrating role-based permissions, allowing only authorized employees to see reports they need to work effectively.

2. Microsoft Power BI
Power BI is a suite of business analytics and reporting tools. It helps businesses connect to various data sources, analyze data, visualize insights, and generate reports to monitor performance and make informed decisions.
It integrates with other Microsoft tools such as Excel, SharePoint, and Microsoft 365 and enables direct data sharing and visualization. It also connects with non-Microsoft applications like Salesforce, Hero Vired, and BrightWork.com, allowing unified reporting across various business applications.
Power BI requires setup and ongoing data management, making it a better fit for data-driven enterprises than for teams seeking plug-and-play simplicity.
3. Tableau
Tableau is an analytics and business intelligence platform that helps businesses visualize and analyze data to extract insights, visualize them, and make data-driven decisions. It is a leading tool for creating interactive dashboards and reports from large datasets, and it offers various products for cloud, on-premises, or desktop use.
While powerful, Tableau’s licensing and setup complexity can be overwhelming for businesses that only need standard reporting across sales, HR, and operations.
4. Looker
Looker is a paid, enterprise-grade business intelligence (BI) platform by Google Cloud. It helps businesses access, analyze, and act on their data in real time. Looker enables businesses to build consistent data models using its proprietary language – LookML, to improve decision-making across the organization.
It’s specifically designed for enterprises and data teams needing deep, governed data analysis and embedded analytics. For non-technical business users, the learning curve can be steep.
5. Zoho Analytics
Zoho Analytics is a popular self-service, cloud-based reporting and BI tool that integrates well with Zoho’s ecosystem and other third-party apps. It helps businesses to analyze data, create visualizations, and generate reports to gain business insights. Through this, it enables businesses to track performance, identify trends, and make more informed decisions.
It’s known for its affordability and ease of use. However, its customization options and scalability can be limited for growing enterprises that require deep integration across diverse business functions.
Choosing the Best Reporting Tool
To choose the best reporting software, assess your business needs, evaluate the software’s features like data connectivity and ease of use, and compare costs and scalability.
Here’s the key consideration to choose the best reporting software:
- Choose the reporting tool that’s intuitive for non-technical users to create and share reports without depending on IT or data teams.
- It must connect seamlessly with your existing systems, like CRM, HR, or project management, to pull real-time data.
- Look for software that automates repetitive reporting tasks and delivers reports on schedule to stakeholders.
- As your business grows, your reporting needs will evolve. Choose a platform that can adapt to new metrics, modules, and teams.
- Ensure the tool provides role-based access and compliance-friendly data handling.
If you’re looking for a unified solution that checks all these boxes, CollabCRM offers an integrated reporting module built right into your everyday operations, helping teams leverage actionable insights with zero friction.
How CollabCRM Can Be a Game Changer
Most of the reporting tools we have discussed in this blog stop at visualization. They show you what’s happening but leave you switching between platforms. But CollabCRM gives you access to your entire organizational performance all in one place.
Being an integrated business operating system, CollabCRM brings People Management, CRM, Invoicing, Project Management, and more under one intelligent layer.
Here’s what makes CollabCRM a game-changer:
- 360° visibility of performance across departments thanks to interconnected CollabCRM modules
- Build and track KPIs, from revenue trends to team productivity
- Customize, download, and share reports with decision-makers for timely and effective decisions
- Role-based insights for managers, HR leaders, IT teams, and more, tailored to their scope.
- Real-time decision support, enabling decision-makers to make decisions without delays.
This way, the CollabCRM Reports module replaces fragmented analytics with a cohesive, real-time decision intelligence engine that helps businesses plan, measure, and scale smarter.

FAQs
Management reporting software is a tool that helps businesses collect, analyze, and present data to create reports for internal use.
Key functions of a report management software includes monitoring performance through metrics like sales and revenue, supporting strategic and operational decision-making with data-driven insights, and ensuring accountability by tracking progress against goals.
The purpose of a report management system is to centralize, automate, and standardize the process of creating and distributing reports to support better decision-making, improve organizational efficiency, and monitor performance.
A good report management system should feature accuracy and clarity, customization and automation, and advanced analytics and visualization.
A report management system (RMS) primarily focuses on organizing, automating, and distributing predefined, historical reports, while business intelligence (BI) software uses data to provide dynamic, interactive, and in-depth analysis for strategic decision-making.
Yes, small businesses can and should use report management software to make data-driven decisions, improve efficiency, and streamline operations.
Automation improves report management by increasing efficiency and accuracy through the automation of repetitive tasks, providing real-time data for faster decision-making, and improving collaboration.


